This is a review of Mahdi’s research of ‘Multisensor Data Fusion Strategies for Advanced Driver Assistance Systems’[1].This paper introduced the current(2009) research result of ADAS on vehicles.The authors then proposed a 4-layer model for multisensor fusion,at last,they proposed using fuzzy logic for multisensor fusion in Automatic Cruise Control(ACC).This is also one of my preliminary research on ADAS.Later on I’ll post the SLAM robot I built for simulating the self-driving vehicle control,as well as practicing the algorithms in Artificial Intelligent for Robotics course on Udacity.
Todo: Although this 27 pages paper has been compressed to 8 pages,but it’s still not neat,make it more shorter.
Requirements of advance driver assistance systems
The other key difference in this method, unlike other researches that focused in one particular application, is that we believe in order to control the vehicle similar to an expert and sober driver, the ADAS systems should not work independently. Instead, after sensor data fusion and decision making, it should run several driving assistance system simultaneously for reliable and robust control of the vehicle. It means in a real word, several actuators should take an appropriate action simultaneously, while most of current DAS systems on the market just carry out one single system at a time; for example Automatic Cruise Control (ACC) or Park assistance each of them act individually.
Optimal sensor selection and multi sensor assembly.
The decision on selecting a proper set of object-detecting sensors should be made based on the capability of available sensors and real-time driving condition. Now, In order to formulate and simulate the selection of object-detecting sensors with respect to various driving situations, the sensors should be capable of evaluating Driver commands (steer angle setting, backing, changing lane, turning a corner and overtaking a vehicle), Relative Vehicle’s Velocity, Traffic Flow (Low or Dense), and Driver’s behavior (Observant, sleepy, drowsy,aggressive, using cell phone, etc.), (Hsieh et al., 2007).
Image sensors have some drawbacks, such as low ability of sensing depth and advantage of higher ability of discrimination than LIDAR and RADAR. Radar shows limited lateral spatial information because it is not available at all, the field of view is narrow, or there solution is reduced at large distances. Although LIDAR has a wide view field that solves part of the previous problems,there are other problems such as low ability of discrimination, clustering error, and recognition latency.
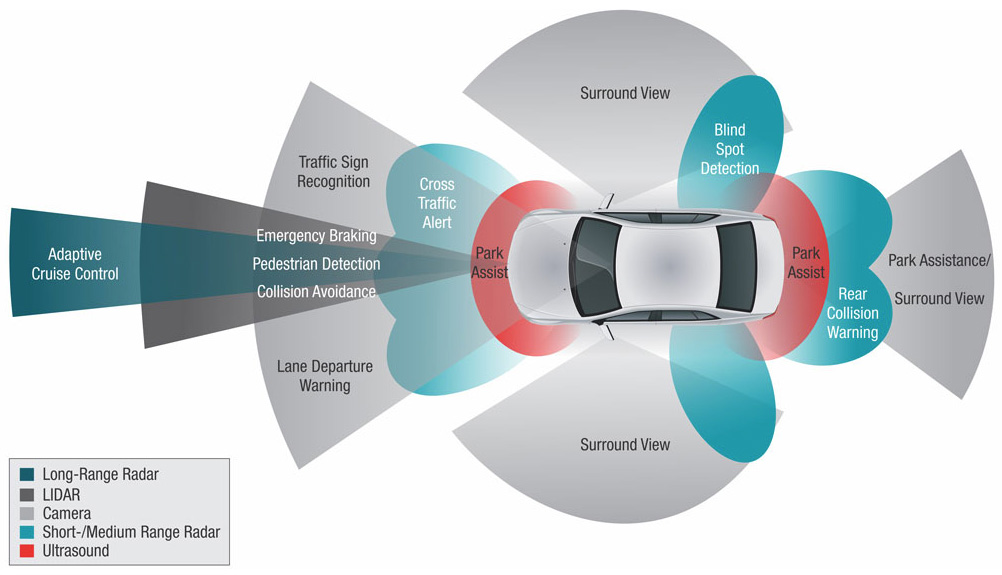
According to advantages and drawbacks of mentioned sensors and various real driving situations, we implement an optimal selection of state of the art and most typical sensors that can be classified into four different types: Radars (RL, RS), Laser scanner (L), Camera Sensors (C) and Ultrasonic Sensor (U). In this project, 16 object detecting sensors among four types of sensors are considered to be assembled on the test vehicle (Figure 3)

Fig. 3. Sensor placement with full coverage, redundancy and sufficient overlapping area The sensor network assembly consists of one Long Range Radar-LRR (2nd generation long range radar by Bosch) mounted for front monitoring (RL), five Short Range Radar sensors(from M/ A-COM / Tyco Electronics) four of them in both sides and one in the front (RS).Four laser scanners (from IBEO GmbH) with broad range and wide viewing angle, two of them in front and the others for rear side (L), three CMOS cameras INKANSC640PG by Aglaia GmbH (Amditis et al., 2006) two of them in side mirrors for rear and blind spot coverage and one in the middle of the front windscreen to face forward (CL); A short range monocular camera for backside (CS), and finally two ultrasonic on both sides (U). The placement of these object-detecting sensors and the main characteristics, such as detecting distance and the field of view, for these object-detection sensors can be seen in figure 3. All the sensors transmit data through a CAN-interface (Wahl & Doree, 2000) to the perception layer.
The placement of these 16 object-detection sensors are based on the following six main functionalities required in a state of the art ADAS. The six key functionalities are adaptive cruise control (ACC), lane departure warning (LDW), lane change assistant (LCA), rear view (RV), lane keeping assistance (LKA) and Emergency Braking System (EBS).

Fig. 4. Active sensors for lane change and overtaking (Top) and vehicle following with safe distance and safe speed according to ACC set point (Bottom).
These functionalities are required to match seven scenarios of straight, back, follow a vehicle, overtake a vehicle, lane change, turn corner, and emergency stop.
These functionalities are required to match seven scenarios of straight, back, follow a vehicle, overtake a vehicle, lane change, turn corner, and emergency stop.
Driver assistance framework based on multi sensor data fusion
After implementing sensor assembly, a practical framework needs to be designed. We assume a driver assistance system as a vehicle-driver-environment interactive closed-loop system; moreover, we focus on not only the current situation of vehicle and driver, but also the future situation by predicting the potential collision probability distribution. In this framework, on-board sensors provide real-time information about drivers, traffic environment, and vehicles. How to configure these sensors is closely related to the application domain. For example, for multisensor ACC systems, radar and camera often suffice, but for pedestrian protection systems, an infrared sensor is essential to robust detection under various weather conditions.
1-Sensor Layer: including onboard environment monitoring sensor, inside driver monitoring sensor and vehicle body sensor e.g. vehicle ego-state and vehicle dynamic module. In General, the external sensors capture object appearance, range, and sound outside a vehicle, a vision based system monitor and record driver’s behavior, and the interior sensors collect vehicle state, such as speed, acceleration, and steering angle. Figure 6 and 7 describe characteristics of two main typical sensors required for this system, LASER and RADAR respectively(Schneider,2005),(Langheim et al.,2001)
The main technical characteristics of a typical Long Range Radar sensor are:
●Frequency: 76-77 GHz
●Range: 1-150 m
●Search Area: 12°
●Speed measurement precision: < 0.2 km/ h
●Angular Precision: < 0.3°
The main characteristics of the current laser sensor are:
●Scan Frequency: 12.5 Hz or 25 Hz
●Horizontal Viewing angle: up to 240° field of view
●Effective Distance range (at reflectivity 5 %): up to 40 m
●Standard deviation of measured distance: +/ – 5 cm
●Eye-safe laser (laser class 1)
2- Perception Layer: this layer aims to give a realistic representation of the environment to the applications; it can be seen as an intermediate layer between the sensorial sub-system and the system applications. It includes sensor fusion of previous layer in order to environment modeling, overall sensor fusion, and future situation assessment.
The role of the perception layer is to:
●Carry out a perception enhancement of the external scenario, even independently on any given application
●Describe the environment and the traffic scenario (obstacles and host vehicle dynamics, road geometry, etc.) in a formal way.
●Support the specific needs of the ADAS system in the reconstruction of the environment
●Act as an intermediate layer between sensors and functions, defined by the I/ O protocols and interfaces.
For the future situation assessment module, future road safety situations are assessed by combining traffic rules, vehicle dynamics, and environment prediction. Since the safety distance varies with the speed of a host vehicle, we adopt preview time rather than safety distance as the measurement of safety response. The safety response time is given as (Cheng et al., 2007):

Where dr is the distance required to respond to the nearest object due to driver response delay, dv is the distance to slow down, ds is the safety distance between the host vehicle and obstacles, and v is the speed of the host vehicle.
3-Decision making agents layer: as its names implies, perform decision carrying out one or several various driver assistant depending the status of previous layers. For example to make decision about “safe distance” in following a vehicle , it refers to the decision about determining a distance in meters that needs to be maintained to a vehicle ahead in order to avoid a collision in case the vehicle suddenly brakes. Safe-distance decision depends on a number of factors such as vehicle type, reaction time, braking distance, road surface and traffic conditions, driver awareness, etc. Over the years, different criteria have been suggested to determine a safe following distance for driving. Often cited is the two seconds rule illustrated in Figure 8 (Irion et al, 2006).
Decision-making agents have two functions: first to generate warning strategies for warning systems, such as route guide systems, haptic alert and warning display devices, and the secondly to plan the actions of the actuators to control the path of the host vehicle. As we know, the parameters of a vehicle model are affected by many factors and vary with the outside environment. Therefore, real-time learning algorithms using fuzzy logic have been applied to solving lateral and longitudinal control problems for a long time and have shown good performance (Cheng et al., 2007).
4-Action Layer: Including two primary sections HMI and Actuators. This layer is responsible for handling the output from all the different applications in order to carry out appropriate warning and intervention strategies and then, to pass the information, suggestions or alarms to the driver through a given HMI. An in-vehicle HCI module.presents visual, sound and haptic warning information from the decision module and the path planning module to the driver. On the other hand action planning affects on actuators to prevent collisions and mitigate the dangerous. These are our final objective in order to approach to safe driving.
Sensor fusion processing
Before the sensors acquisition task is taking place, the sensors should be calibrated one by one in both time and space. That means, opposed to single sensor, a multi sensor system has to be synchronized, or the data acquired has to be time-aligned. Next, the sensors have to be ‘space-aligned‘, meaning that displacements (in a mathematical sense) between the different (spatial) sensor coordinate systems have to be determined.

Sensor refinement
Generally speaking, because of its natural complexity, the low level processing tasks have not been inspected as detailed as processing steps which are taking place within the object and situation refinement. Actually compared to the object and the situation refinement level, these low level tasks have to cope with a huge amount of raw sensor data. In addition, due to the quite different sensor characteristics, imaging, ranging, etc. the raw sensor data may appear completely different as well.
Calibration and time alignment
In general, multi sensor systems are not synchronized, i.e. each sensor aquises its measuring at a different and specific time. Actually it would be difficult or useless to establish a multi sensor processing and the perception of the environment based on measurements from different sensors taken at different times; because they probably show contradictory states of the environment. Hence, a multi sensor system has to be time aligned.
Sensor modeling
In automotive applications, the term ‘sensor model’ is understood as a model of sensor’s data and how the sensor information matches the environment, including both model of the sensor’s data and model of the vehicle’s environment. This is mostly done individually for some types of sensors, e.g. for RADAR sensor probabilistic models are widely accepted, but not for a multi sensor system ‘as a whole’. Until now, no common model was found which is able to represent all the different types of sensor data emerging in the field of preventive safety applications on these low levels e.g. radar, laser, images, etc.
Object refinement

Fig. 10. Correlation between input-output of sensor refinement and object refinement Hence, the output of the object refinement level generally consists of a list of objects with specific parameters or attributes (e. g. their position, their velocity, their height…) The key functions of ‘object refinement’ are, among others, considered to be feature extraction, (single or multi) object tracking, ‘observation-to-track’ association and track maintenance (in the case of multi object tracking), as well as object classification (Strobel & Coue, 2004).
Feature extraction
The following example shows feature extraction via segmentation in LIDAR sensor data: In order to segmentation of the environment, first we have to perform clustering. The readings, e.g. from a LIDAR are subdivided into sets of neighbor points (Figure 11, left) by taking the proximity between each two consecutive points of the scan into account. A cluster is hence, a set of measures (points of the scan) close enough to each other, which due to their proximity; probably belong to the same object (Mendes et al., 2004). The segmentation criterion is based on two consecutive measurements of laser emitter, rk, rk+1; we can conclude that they belong to the same segment if the distance between them fulfils the following expression:
 Where Rmin = min {Rk, Rk+1}, Rk+k+1 =|Rk-Rk+1| and θ is angular resolution of Laser sensor. α was introduced to reduce the dependency of segmentation with respect to the distance between the Laser Emitter and the object, and L0 to handle the longitudinal error of the sensor. If L0 = 0, then α represents the maximum absolute inclination that an object’s face can have to be detected as a unique segment (Figure 11). Continuing the line fitting (Mendes et al., 2004) and considering the whole near lines as a single object we would be able to determine the object’s type, comparing with a model-based database. In that step using a technique called “Identity estimation”,relies on special classification algorithms that are used to recognize an object on the basis of some significant extracted features-the shape or patterns- of various vehicles detected on a road, for example. In car safety applications, these kinds of algorithms can also be employed to construct a list of the objects (e.g., a tree, a motorcycle, a road sign, etc.) surrounding the host vehicle.

 Fig. 12. LIDAR raw data (left side) and extracted features on the right side (provided by INRIA Rhone-Alpes)
Normally the vehicle speed is measured by an encoder coupled with axle. But in sensor based system we can perform a vehicle speed estimation using two observations from a static object during a period of T. If we assume (r1, θ1) and (r2,θ2) as two observations like figure 13 left, then vh, speed of host vehicle is:
 Where m is the number of the consecutive frames and is generally ≥ 2 for improving the accuracy of velocity. Here, we assumed that over a small interval of time mT, the driving direction of the host vehicle is consistent with the Y-axis in the Cartesian coordinates system XOY. Now after determining the speed of vehicle host, we can define the coordinate system of two segments at position P0=(x0, y0) and P1=(x1, y1), while:


Sequential estimation and filtering problems
This is basically a filtering problem – called the ‘sequential estimation problem’. One of the most famous filter used in the automotive sector to cope with these problems is called ‘Kalman filter‘ (see (Kalman, 1960) and (Welch & Bishop, 2001) for details) and its extended version, the ‘extended Kalman filter’. This probabilistic filter is based on a model of the evolution of the object’s attributes in time, called the dynamic model, and on a sensor model (Strobel & Coue, 2004).
Indeed both, the ‘Kalman’ and the ‘extended Kalman filter’ are simply efficient implementations of the general ‘Bayesian filter‘ (compare (A.H. Jazwinski, 1970), for example)) – with strong constraints to linearity of the dynamic model and ‘Gaussian noise’ in the case of ‘Kalman filter’. But more recent implementations of the ‘Bayesian filter’, namely the so called ‘particle filters‘ (compare (A. Doucet et al., 2000), (S. Arulampalam et al., 2002)) become more and more popular in these fields, as they allow an efficient approximation of at least all ‘Bayesian’ filtering problems. On the other hand, ‘Bayesian filters’ are not the only technique used to come up with the ‘sequential estimation problem’. For example, solutions based on the fuzzy logic are proposed as well (see Ggruyer, 1999)), but they use the same prediction scheme (see Figure 14).
Fuzzy fusion methodology
Here we propose a fuzzy logic approach as sensor fusion, just for ACC driver assistance system which is applicable on other driver assistance system in a similar manner.

Structure of fuzzy logic system:
The initial system structure is defined by input and output variables with their linguistic terms. Linguistic variables are components of fuzzy logic systems that “transform” real, crisp values, here from sensors, into linguistic values. The output also defined by some linguistic variables but finally should be defuzzified in to real output value (Figure 16).

Let’s have a brief description on figure 18. In this graph, Blue curve is the real position of front vehicle with different acceleration rate at different times. The Red Curve is estimated distance according to multisensor data fusion using fuzzy approach. As can be seen from figure 18 in the area with multi detecting sensors, (e.g. in distances < 50m) we saw more fluctuations, But in far distance (distance >100m) we saw better following, even with just a single LRR sensor! The reason is very clear; because the nature of different multi sensors (In lower distances), they feed the system a little bit different measurements and data, which will cause some fluctuations in overall distance detection. But in general, this is more reliable than a single sensor in far distance, despite a little fluctuation. The worst deviation found in this stage was about +-26.5 meters.

Moving average filter
This is known as a moving average filter because the average at kth instant is based on the most recent set of n values. In other words, at any instant, a moving window of n values is used to calculate the average of the data sequence (see Figure 19).
 1.the filtering cannot be initiated reliably until n measurements have been made, and
2.We need to store the value of x-nk which, depending on the way the algorithm is coded, may require up to n storage locations.
 The following expression is Exponentially Weighted Moving Average Filter. When used as a filter, the value of xk is again taken as the filtered value of xk . Notice that now, calculation of xk does not require storage of past values of x, and that only 1 addition, 1 subtraction, and 2 multiplication operations are required. The value of the filter constant α, dictates the degree of filtering, i.e. how strong the filtering action will be.


Fig. 22. Sensor Data Fusion before and after applying moving average filter
[1]Ghahroudi, Mahdi Rezaei, and Reza Sabzevari. Multisensor data fusion strategies for advanced driver assistance systems. INTECH Open Access Publisher, 2009.
Feature image source : Texas Instrument

One thought on “A Review of Multisensor Data Fusion for ADAS”